I had a fun chat with a bonds trader. Among a plethora of things, we talked about his Master’s (Financial Engineering) project, which got me interested in the maths and matrix manipulations (which I had missed) and I got the itch to play around and get a better understanding of the maths he was working with.
In recent engineering roles, my responsibilities spilled over from actual engineering to some aspects of strategic planning. I handled most of the outgoing proposals, and I worked closely with our Director of International Business Development on making sure proposals were as tailored as can be for a given client/project. Inevitably, I had to play around with some financial modelling, then special purpose vehicle (SPV) structures, and generally tried to plan projects in consideration of available subsidies, ownership stakes, and how that enabled monetisation of carbon credits. Sure I designed engineered systems, but I was able to pitch the projects while discussing cashflows, showing knowledge of the technical but also financial aspects, and portraying the company I represented as a really credible partner not just on the technical solution, but also in handling the project and navigating pain points.
I learned to play with the numbers. At the behest of the C-suite and business development team, I built a nice dashboard template with a waterfall chart for recurring presentations. A quick visual demonstration that the contractual milestones and associated payments offset the project’s scheduled expenses and that, the project was cash-flow positive at every stage. I realised I quite enjoyed the financial aspects, the real levers to enable a project. I reviewed my engineering economics materials and discovered a newfound appreciation for them.
Which brings us to the Streamlit project. I wanted a tool to suggest a portfolio balance, mostly to learn by application about Modern Portfolio Theory.
Modern Portfolio Theory (MPT)
Harry Markowitz is credited for developing these core ideas to construct a portfolio which aims to maximise expected returns for a given level of risk. Here are some key concepts:
-
Risk-Return Tradeoff: MPT quantifies the intuitive idea that higher returns require accepting higher risk. Investors are assumed to be risk-averse, meaning they will choose a less risky portfolio over a riskier one if both offer the same expected return.
-
Diversification: This is the cornerstone of MPT. By combining assets with low or negative correlations (assets that do not move in the same direction at the same time), investors can reduce the overall volatility (risk) of the portfolio without necessarily sacrificing expected returns. This helps eliminate unsystematic risk (specific to individual assets).
A bit more than 50% of individual stocks eventually dip and never recover. A stock that loses 50% of its value needs to gain 100% from that point just to break even. Diversification drastically reduces the impact of that risk on a given portfolio.
-
Measuring Risk and Return:
-
Expected Return is the weighted average of the expected returns of the individual assets in the portfolio.
-
Risk is measured using the statistical concept of standard deviation (std. dev./SD/σ/volatility) of returns -> this is the square root of variance. The portfolio’s risk is a function of the variances of each asset and the correlations between all pairs of assets.
-
Efficient Frontier: When all possible portfolios are plotted (with risk on the X-axis and expected return on the Y-axis), the portfolios that offer the highest expected return for a given level of risk (or the lowest risk for a given level of return) form a curve called the efficient frontier. A rational investor will only choose a portfolio that lies on this frontier.
-
-
Capital Asset Pricing Model (CAPM): Built upon MPT, CAPM is a model used to determine the theoretically appropriate required expected return of an asset, given its sensitivity to market risk (beta, or (\beta )). It helps to price individual assets in the context of the overall market portfolio.
There are a bunch of associated simplifying assumptions (rational investors, no transaction fees, etc) but at its core MPT remains foundational in its logic, particularly regarding diversification strategies.
And so, I set out to build a tool which would apply this theory to suggest an allocation of selected stocks based on a risk profile. Specifically using Mean-Variance Optimization
- : make a list of stocks that can be picked by the user: I went S&P500, NASDAQ100 (big overlap with the first), and FTSE100. Learned to work with some APIs, ended with yfinance.
- : Let the user pick (up to 25) stocks for consideration for their portfolio.
- : fetch historical data to compute price variance and volatility for the selected stocks: more Yfinance api. Annualised returns are computed as well as the covariance matrices.
- : User picks a portfolio optimisation strategy. At the time of writing they are the following:
| Strategy | Description |
|---|---|
| Mean-Variance Optimization (MVO) | - Classical Markowitz model — maximizes return for a given risk aversion. Optionally adjusts expected returns using sentiment analysis. |
| Risk Parity | - Balances portfolio so each asset contributes equally to total risk (ignores returns). |
| Hierarchical Risk Parity (HRP) | - Clusters correlated assets to achieve diversified risk allocation (uses hierarchical clustering). |
- : User inputs a risk aversion λ scaled from 0 to 50. Frankly, this implementation doesn’t have much real-world meaning. A 5 means more or less depending on the expected returns. But the purpose was to play around with the optimisation function for a given lambda - yielding a point along the efficient frontier. Both variance and expected return are scale dependent (are we considering daily or purely annualised returns), but risk aversion being 1 or 5 or 10 doesn’t intrinsically correspond to a specific risk level tolerance. It’s a tuning knob, not a calibrated quantity with specific meaning regarding risk aversion. In practice, varying λ in small increments would draw out the frontier. Fundamentally, λ = 0, however, chases maximised returns (no consideration of risk) and a very large λ would strongly penalize variance.
At the tangent point of the efficient frontier exists the maximum slope (return/risk) this is the best risk-adjusted return portfolio allocation, which maximises the Sharpe Ratiob (this is independent of risk aversion). I may add this as a feature in the future.
- : After selecting an optimisation method, the math runs in the background and out comes:
Portfolio expected annual return Portfolio volatility (standard deviation) Sharpe ratio (risk-adjusted return, using the user-set risk-free rate) A pie chart of weight allocation The results are presented against the indices. In other words, how would the portfolio fare against the expected performance of the FTSE100, NASDAQ100, and S&P500.
For MVO, I added an optional toggle for sentiment analysis to lightly skew the results of allocation based on headlines. I attempt to give a positive, negative, or neutral outlook based on headline analysis of news article featuring the selected tickers. I used BERT as a pre-trained starting point, but results are mid (at best). Currently collecting data and working on a tagging function to further train the model for this application. This is not my day job and I have limited NewsAPI requests so it’s a slow process.
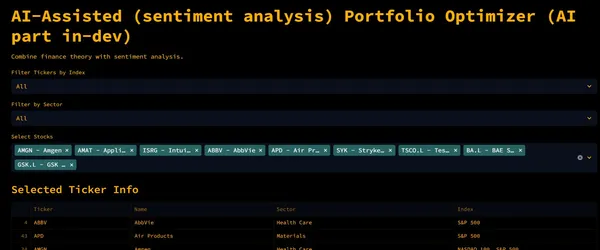
For fun, I made the colour scheme reminiscent of Bloomberg’s Terminal
Visit the project here
Doing these kinds of projects remind me how fun and powerful programming is. It’s really learning by doing. There’s little to no risk of breaking things beyond maybe learning something more.